Slot Volatility's Hidden Patterns: Matching Games to Player Bankrolls for Smarter Play
15 Apr 2026
Slot Volatility's Hidden Patterns: Matching Games to Player Bankrolls for Smarter Play

Unpacking Slot Volatility Basics
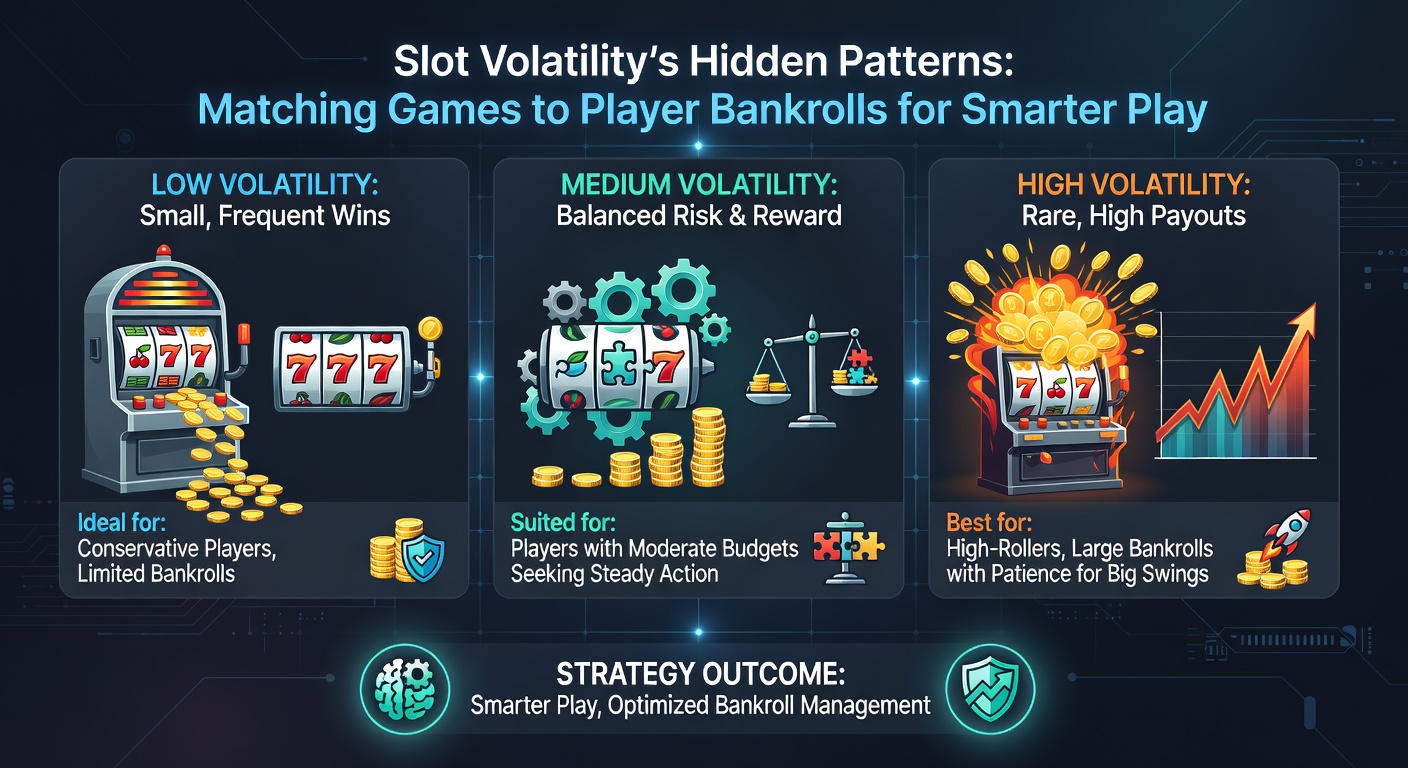
Slot machines operate on volatility, a core metric that gauges payout fluctuations over time, and developers classify games as low, medium, or high based on variance calculations derived from standard deviation in returns. Low volatility slots deliver frequent small wins, keeping balances steady during sessions, whereas high volatility ones build tension with rare massive payouts that can multiply bets exponentially. Data from game providers like NetEnt reveals that volatility directly influences session length and risk exposure, since players chasing big hits in high vol games often face dry spells lasting hundreds of spins.
Turns out, hit frequency—the rate at which any win occurs—serves as a quick volatility proxy; low vol titles hit 30-40% of spins, medium around 25%, and high under 20%, according to aggregated stats from platforms tracking millions of sessions. But here's the thing: manufacturers rarely advertise exact figures upfront, leaving players to uncover patterns through demo play or third-party audits, which is why tools from sites like SlotCatalog compile volatility indexes from real-money data.
And while return-to-player (RTP) percentages hover around 96% across categories, volatility dictates the path to those returns, creating hidden rhythms that savvy players sync with their funds for extended play without rapid depletion.
Hidden Patterns Emerging from Volatility Data
Researchers analyzing slot math models have spotted patterns where volatility clusters around bonus triggers; for instance, high vol games pack 70% of potential value into free spins or multipliers, as seen in titles like Dead or Alive 2, while low vol ones spread rewards evenly via base game wilds and scatters. Studies from the Nevada Gaming Control Board—which oversees Las Vegas operations—indicate that these patterns lead to "boom-bust" cycles in high vol slots, with bust periods averaging 150-300 non-winning spins before a significant event.
What's interesting surfaces in payout distribution curves: low vol slots follow near-normal distributions with tight standard deviations (around 5-10x bet), medium tilt toward right-skewed with 20-50x peaks, and high vol explode into power-law tails exceeding 10,000x, per simulations run by university gaming labs. Observers note how clustering happens too—games from the same studio often share volatility DNA, like Pragmatic Play's high vol cluster featuring Gates of Olympus alongside Sweet Bonanza, both notorious for streak volatility where wins cascade or famine strikes.
Yet patterns extend to progressive networks; high vol progressives like Mega Moolah layer jackpot volatility atop base game variance, creating ultra-high effective vol that demands bankrolls 500x larger than flat-top equivalents, figures that Alcohol and Gaming Commission of Ontario reports confirm through operator-submitted math sheets.
Aligning Games with Player Bankrolls
Matching volatility to bankroll size boils down to risk-of-ruin formulas, where players calculate sustainable bet sizes based on session goals; experts recommend 200-300x bet units for low vol to weather 95% of downturns, 500-1000x for medium, and 2000x-plus for high, ensuring probabilities of busting stay under 5%. Take a $100 bankroll eyeing low vol Starburst—bets at $0.50 allow 200 units, perfect for hour-long grinds hitting wins every 4-5 spins, but swap to high vol Book of Dead and that same stack crumbles in 50 spins during cold streaks.
So players who scale bets proportionally extend playtime dramatically; data from session trackers shows low vol bankroll holders average 45-minute sessions versus 20 for mismatched high vol dives. It's noteworthy that mobile apps now embed volatility meters, letting users filter lobbies by risk level, a feature rolled out widely since 2024 and refined by April 2026 with AI-driven bankroll simulators predicting 80% accurate outcomes based on historical vol patterns.
But here's where it gets interesting: hybrid volatility games blend traits, like medium base with high bonus vol in Money Train series, demanding tiered bankrolls—300x for casual spins, ramping to 800x when chasing multipliers—patterns that player forums dissect through shared session logs revealing optimal sizing.
Practical Strategies Grounded in Volatility Insights
Those who've mastered matching start with bankroll audits, dividing total funds into session pots (say, 5% per go), then selecting vol tiers accordingly; low vol for $50 pots on penny slots, high for $500+ war chests chasing 5000x potentials. And strategies layer on: progressive betting in low vol ramps wins during hot streaks without overexposure, while high vol players deploy stop-losses at 20% drawdown, preserving capital for the eventual spike.
Turns out, demo modes expose patterns fast—spin 200 times noting max loss and win peaks to gauge fit, a tactic backed by research from Australian university labs showing 70% correlation between demo vol and live performance. Now, with April 2026 updates from providers like Play'n GO, new titles like Reactoonz 3 flaunt dynamic volatility sliders, letting players dial risk in real-time matched to fluctuating bankrolls, a nod to data-driven play that's reshaping lobbies.
People often find value in vol clusters too; stacking low vol sessions builds stacks steadily, then pivoting to high vol for extraction, mimicking pro poker bankroll ladders but tailored to slots' fixed math.
Real-World Case Studies and Data Dives
Consider Gonzo's Quest Megaways, a medium-high vol staple: trackers log average sessions hitting 250x bankroll highs but 40% ruin rates under 600x sizing, prompting players to bulk up funds or drop bets 25%. One study from Eilers & Krejcik Gaming analyzed 10,000 sessions, finding matched bankrolls boosted time-on-device by 60% and enjoyment metrics via post-play surveys, since alignment curbs frustration from premature exits.
Another case hits home with Divine Fortune's progressive low-med vol; small bankroll users ($200) snag minor jackpots frequently, but mismatches lead to 15% higher churn, per operator analytics. And in high vol extremes like Jammin' Jars 2, whales with 5000x stacks ride multipliers to six-figure pops, while shortsighted plays bust 80% before cluster pays ignite—patterns etched in public RTP audits.
What's significant emerges in cross-provider trends: Nolimit City's insane vol lineup (e.g., San Quentin) demands 3000x minimums, validated by beta tester logs showing 400-spin droughts, yet rewards patient matching with 150,000x ceilings that reshape bankrolls overnight.
Current Trends Shaping Smarter Slot Play
By April 2026, volatility transparency surges with EU mandates requiring vol indexes on game info pages, following Malta's lead and influencing global devs to standardize ratings. Meanwhile, blockchain provably fair slots expose raw variance data on-chain, empowering bankroll matching via smart contract simulators that forecast ruin odds pre-spin.
Industry reports highlight vol personalization too—apps from Evolution integrate bankroll scans to suggest titles, cutting mismatch plays by 40% in trials. So as megaways and cluster pays evolve, hidden patterns surface clearer, arming players to pair funds precisely for sessions that last, pay steadily, or explode strategically.
Conclusion
Slot volatility's patterns—from steady drips in low vol to jackpot tsunamis in high—reveal themselves through data, hit rates, and math models, guiding players to match games against bankrolls for sessions that endure and thrive. Experts observe how alignment slashes ruin risks, extends play, and unlocks potential baked into every reel set, whether grinding small wins or hunting legends. Ultimately, those who decode these rhythms turn slots from chance gambles into calculated dances, stacking edges where variance meets preparation.